How do you analyze gross profit? What methods can be used?
To run an analysis, you need to compare gross profit across two periods—for example, the current period against a baseline. The baseline could be the previous period, the budget, or the forecast.
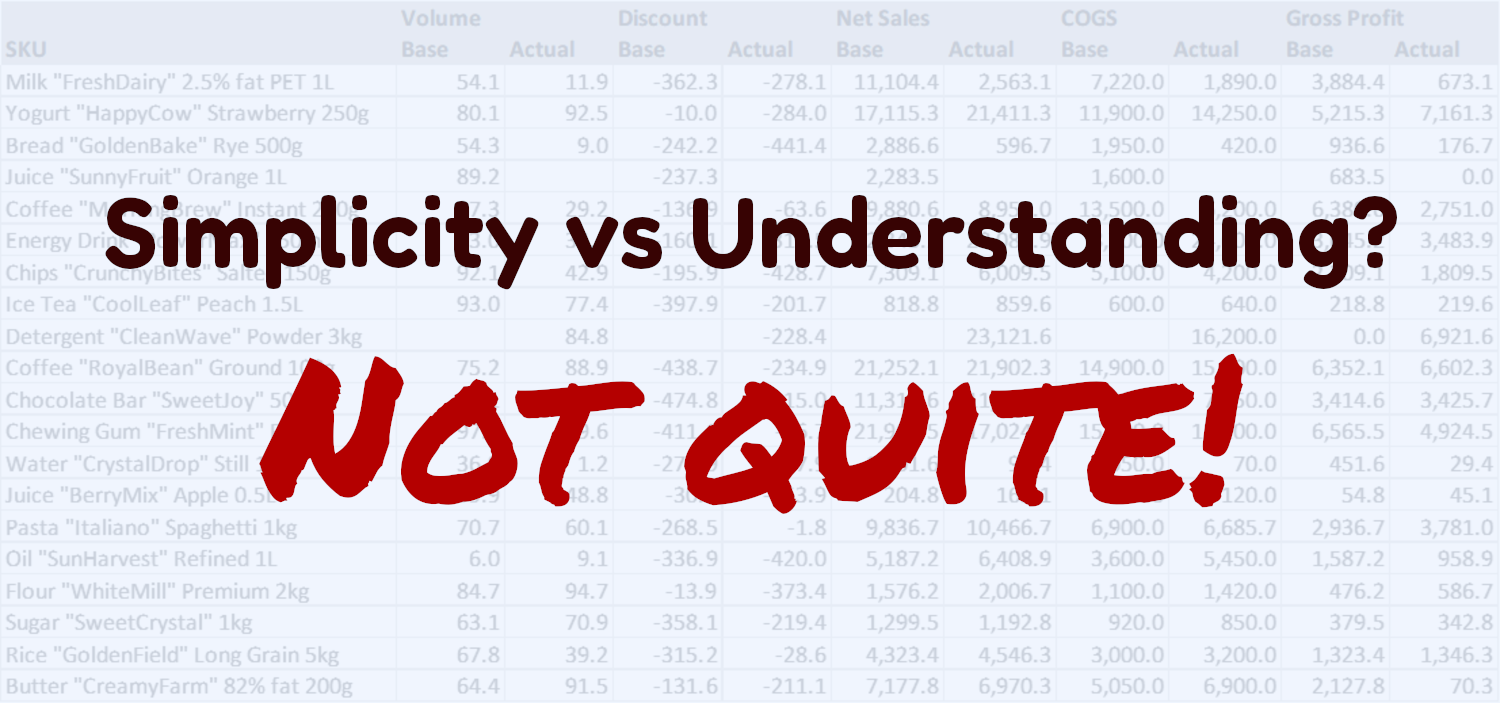
The simplest way
The easiest approach is to calculate both the absolute and relative variance of gross profit and its main drivers.
For example, for
GrossProfit = Volume * (Price * (1 - Discount) - COGS)
To calculate the gross profit variance:
ΔGrossProfit = GrossProfitactual - GrossProfitbase
%GrossProfit = GrossProfitactual / GrossProfitbase - 1
And its drivers:
ΔVolume = Volumeactual - Volumebase
%Volume = Volumeactual / Volumebase - 1
ΔPrice = Priceactual - Pricebase
%Price = Priceactual / Pricebase - 1
ΔDiscount = Discountactual - Discountbase
ΔCOGS = COGSactual - COGSbase
%COGS = COGSactual / COGSbase - 1
After the calculation, you can see:
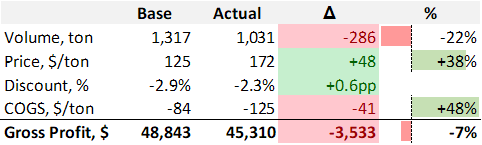
You can see the changes in the metrics, but the size of the impact (effect) of each driver on gross profit is not clear.
So, it's a simple calculation, but it doesn't show what actually drove the result.
The best way
Another way is variance analysis.
This method is more complex to calculate, but it lets you break down the change in gross profit into separate drivers and quantify the impact of each driver in profit units. This helps you understand why gross profit changed.
In gross profit variance analysis, you can highlight the following drivers: Total Volume, Mix, Discount, COGS, Price. In addition to these, you can also include the impact of new products (NewSKU) and products removed from the assortment (DelistedSKU).
To run the calculation, the following formulas are used:
TotalVolume = (TotalVolumeactual - TotalVolumebase) * %Sharebase * ((1 - %Discountbase) * BasePricebase - UnitCOGSbase)
Mix = TotalVolumeactual * (%Shareactual - %Sharebase) * ((1 - %Discountbase) * BasePricebase - UnitCOGSbase)
Discount = TotalVolumeactual * %Shareactual * ((1 - %Discountactual + %Discountbase) * BasePricebase - UnitCOGSbase)
COGS = TotalVolumeactual * %Shareactual * ((1 - %Discountactual) * BasePricebase - UnitCOGSactual + UnitCOGSbase)
Price = TotalVolumeactual * %Shareactual * ((1 - %Discountactual) * (BasePriceactual - BasePricebase) - UnitCOGSactual)
Additional drivers are defined as follows:
NewSKU = if Volumebase = 0 and Volumeactual ≠ 0 then GrossProfitactual
DelistedSKU = if Volumebase ≠ 0 and Volumeactual = 0 then -GrossProfitbase (negative GrossProfitbase)
The calculation is done for each product, and then the values of the drivers are summed up.
As a result, you get the full picture with the impact of each driver shown in profit units.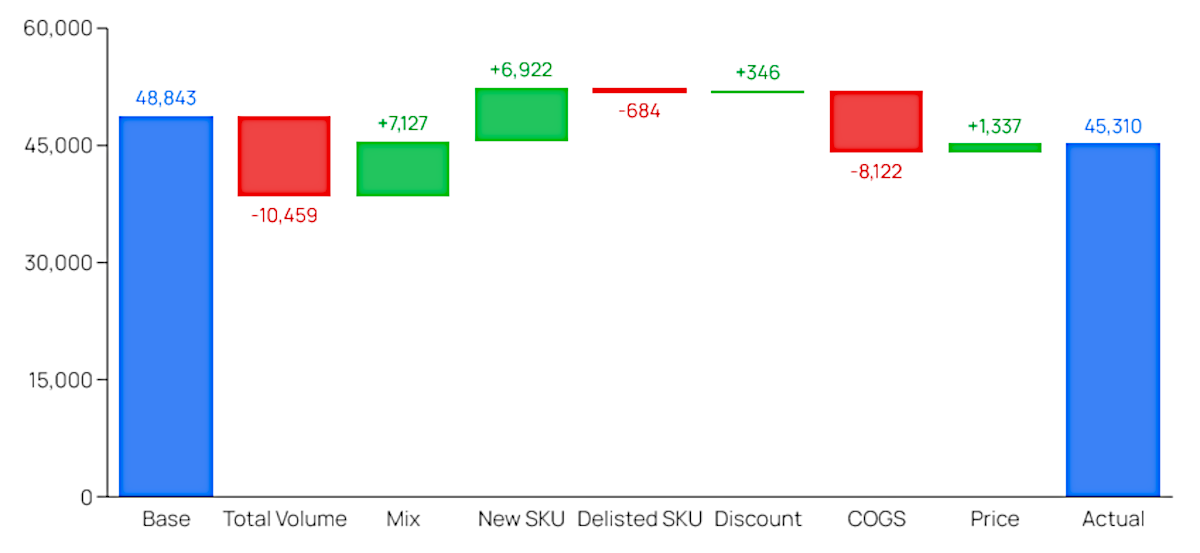
This type of analysis can be done with spreadsheets. It requires experience working with them, knowledge of FP&A, and a significant amount of time. But you can easily overcome these challenges by using Fincontrollex’s fully automated Gross Profit Variance Analysis tool: https://www.fincontrollex.com/analyses/gross-profit-variance-analysis
How to use Fincontrollex’s Gross Profit Variance Analysis
You can find the tool by the link https://www.fincontrollex.com/analyses/gross-profit-variance-analysis
You can use this tool completely free of charge; registration is required. Therefore, when you open the page, you should register first. The registration process is standard: enter your name, email address, and password (with confirmation), and accept the terms. Then wait for the confirmation code sent to your email address and verify your email.
After signing in, you will see two buttons: “Download Template” and “Upload Template”.
The workflow is very simple:
- Download the template (click “Download Template”).
- Populate the downloaded template with your data.
- Upload the completed template for analysis (click “Upload Template”).
Preparing the template
The template consists of two tabs:
- data - for your data input
- how to use - detailed instructions for completion
On the data tab, you should clear the existing sample data and replace it with your own. In column A starting from row 3, paste your list of product names. Then complete Volume, Discount, Net Sales and COGS for two periods: the base period and the period you want to compare against (for example, prior month actuals vs. current month actuals; or budget vs. actuals). You can label the compared periods as follows: in cell B2 — the base period name; in cell C2 — the actual period name. You can also specify units of measure for Volume (cell C1, default is ton) and for Net Sales (cell G1, default is $). For more detailed guidance, see the “how to use” tab. Once the data is filled in, upload the template on the service page using “Upload Template”.
Gross Profit Variance Analysis results
After the upload is completed, you will immediately see the results of the gross profit driver analysis (as in the screenshot below).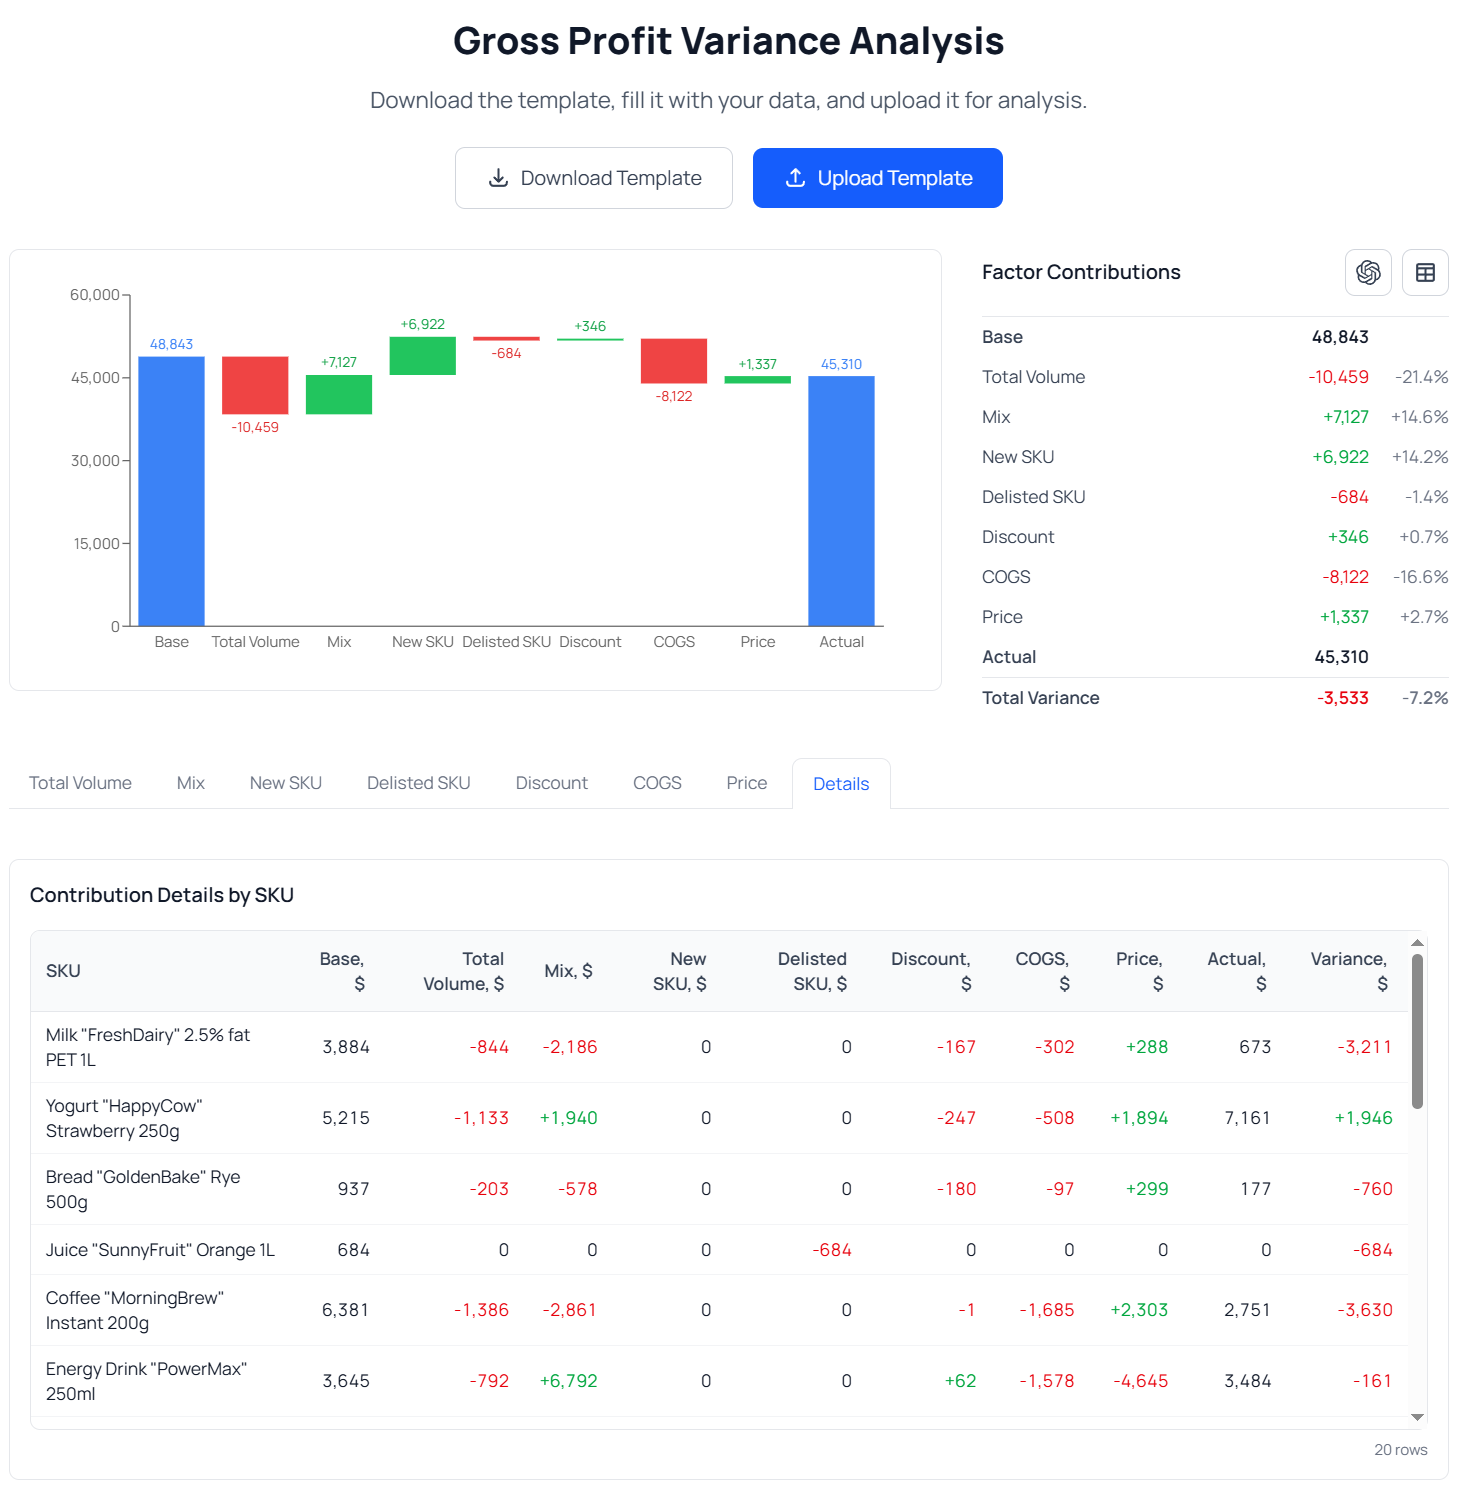
Let’s review in more detail what Fincontrollex provides.
Waterfall chart
The waterfall chart allows you to quickly understand which drivers increased gross profit and which decreased it. For example, in the chart above, the Total Volume and COGS driver are the most unfavorable variances, while the Mix (assortment) driver and New SKU, conversely, are favorable, meaning they contributed to growth.
This means gross profit changed primarily because of the decline in Total Volume (-10,459) and the increase in COGS (-8,122), as well as due to a shift in the mix toward higher‑profit products (+7,127) and the introduction of new products (+6,922). Next, we will look at how to identify the key products that drove these effects.
Factor Contributions
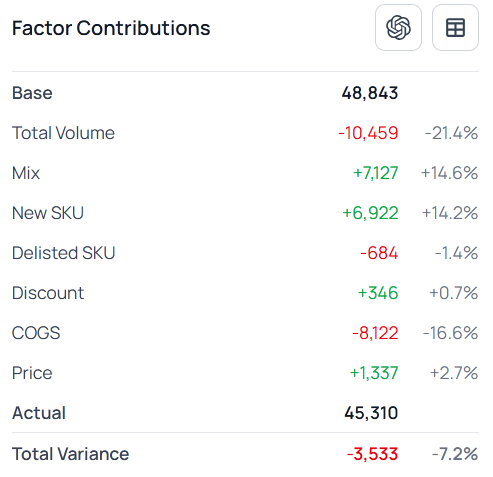
This is a tabular presentation of the gross profit variance analysis results. In addition to the waterfall chart, this table shows the absolute change in total gross profit (-3,533) and the percentage change (+7.2%) and the changes for each driver.
Note the two buttons in the top-right corner of the table.
- The left button allows you to send a ready-made prompt with the analysis results to ChatGPT and receive a short summary of the findings. This feature is especially useful for those preparing commentary for other stakeholders.
- The right button allows you to export the analysis results to an Excel file. This is useful for those who want to perform additional analysis or use the output for other purposes.
Detailed driver analysis
Results should be analyzed from the general to the specific: first, identify the drivers that had the largest impact on the outcome; then identify the products and the variances within those products that produced such changes. This section is specifically designed for that drill-down.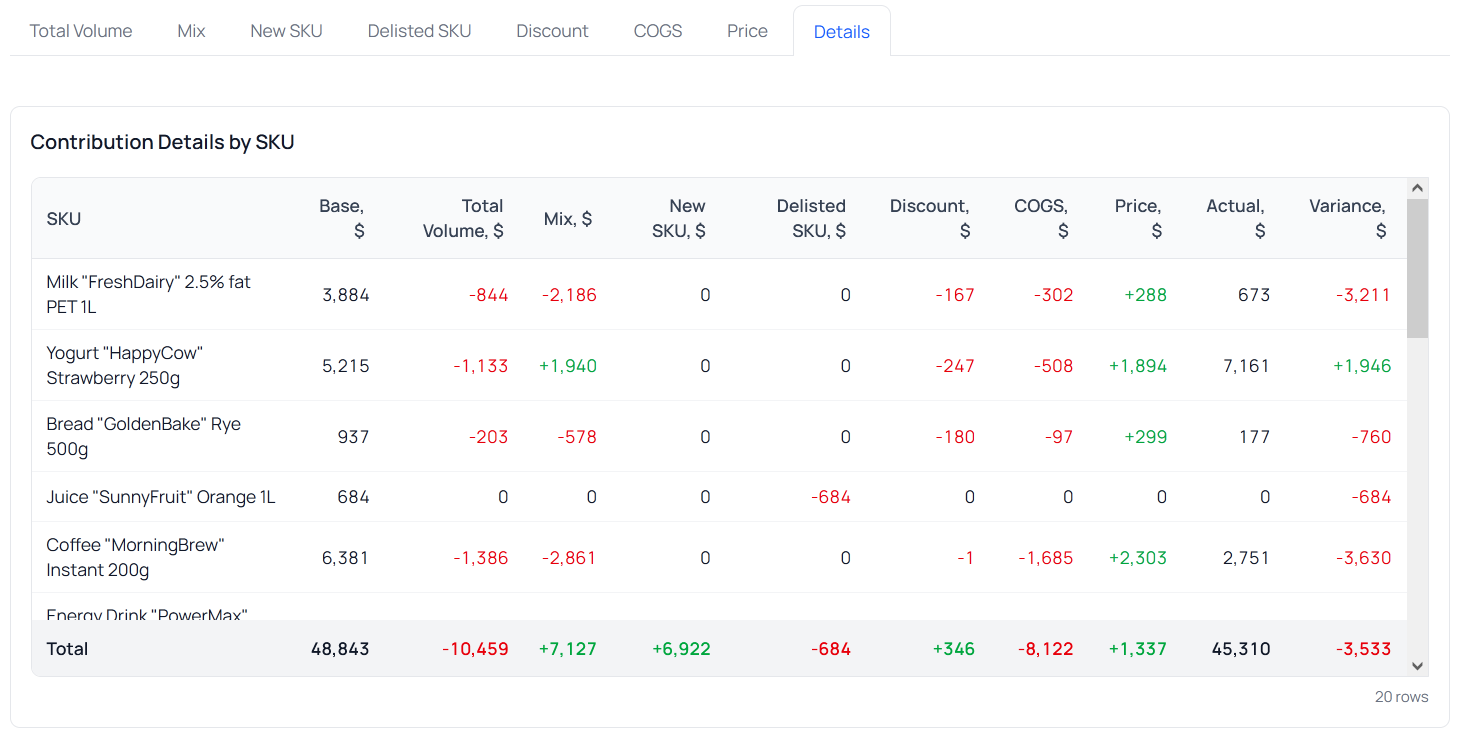
By opening the tab for the driver you are interested in, you can see the Top 5 products that contributed to that driver, as well as a table with absolute and relative variances across all products. On the Details tab, you can review the calculation of each driver by product.
Earlier, we determined that one of the primary drivers of the gross profit change was COGS. Moreover, the price driver reduced gross profit by $8,122. Let’s move to the COGS tab and identify the product-level changes that caused this outcome.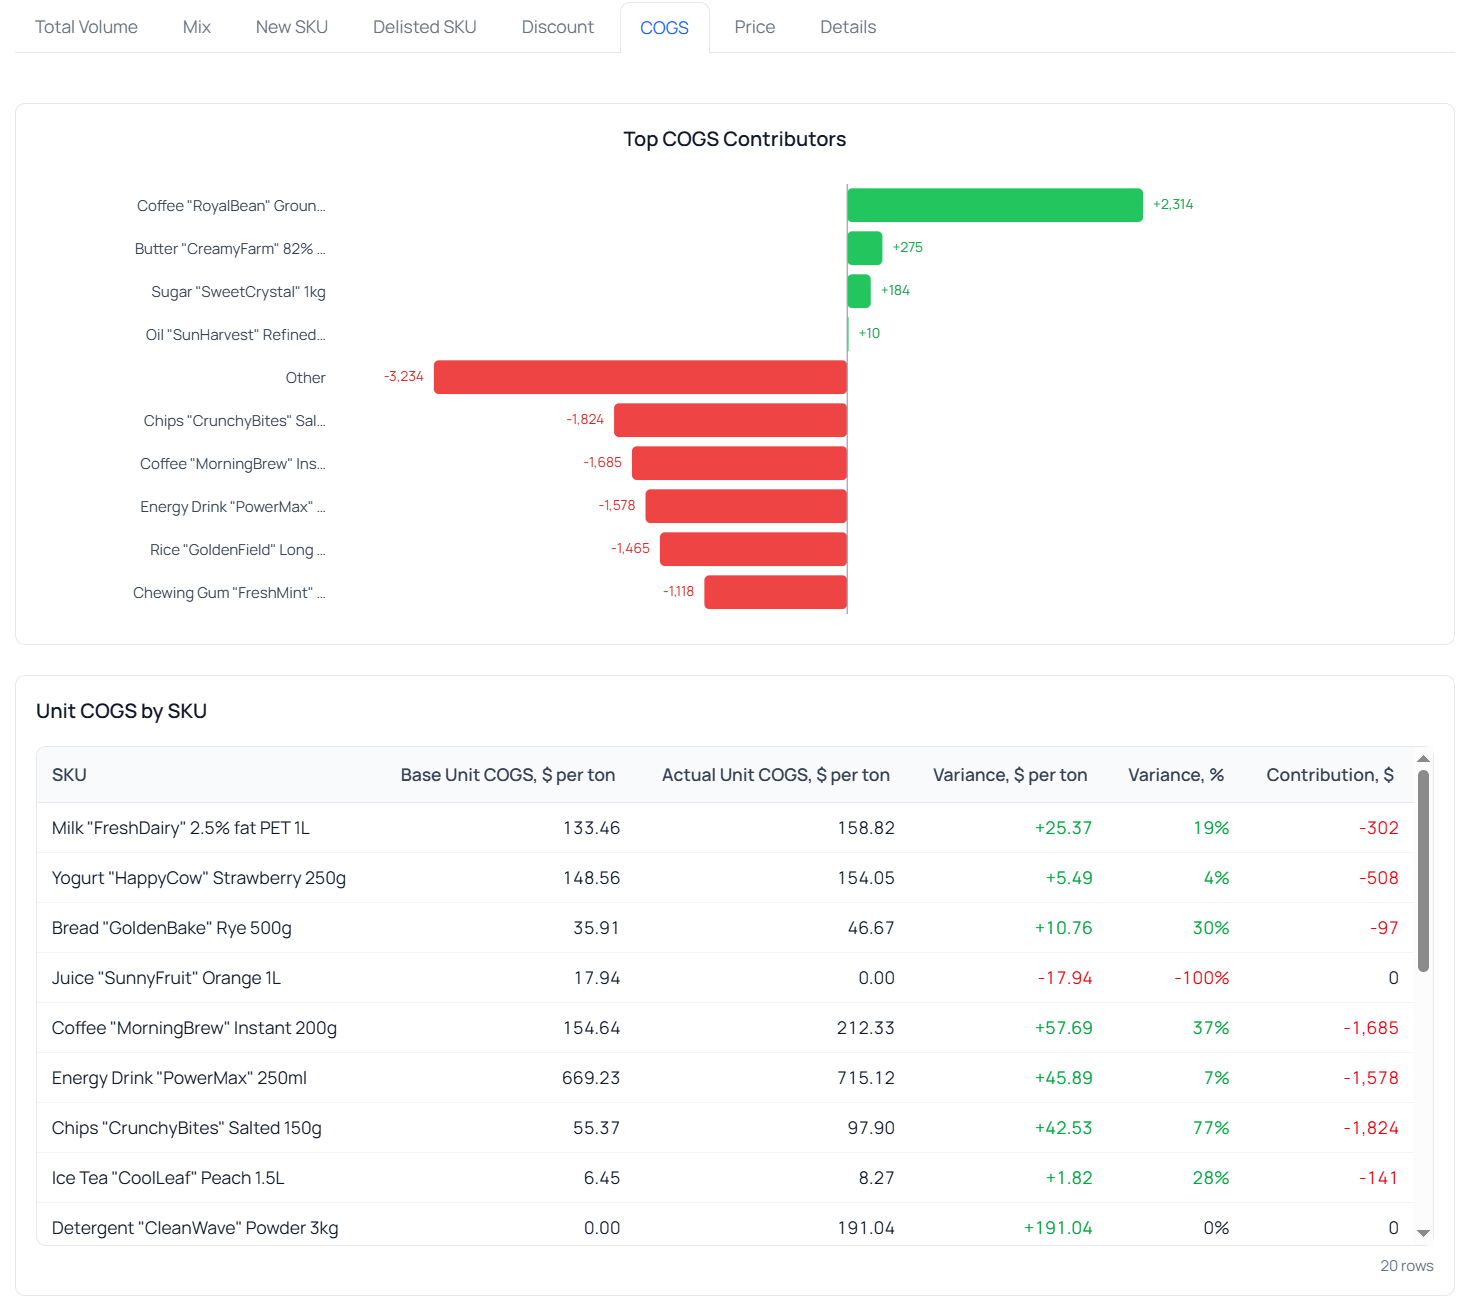
In the chart, we see that the main negative impact on COGS comes from changes in four products. Let’s sort the table in ascending order to bring these products to the top. To do so, double-click the Contributions column.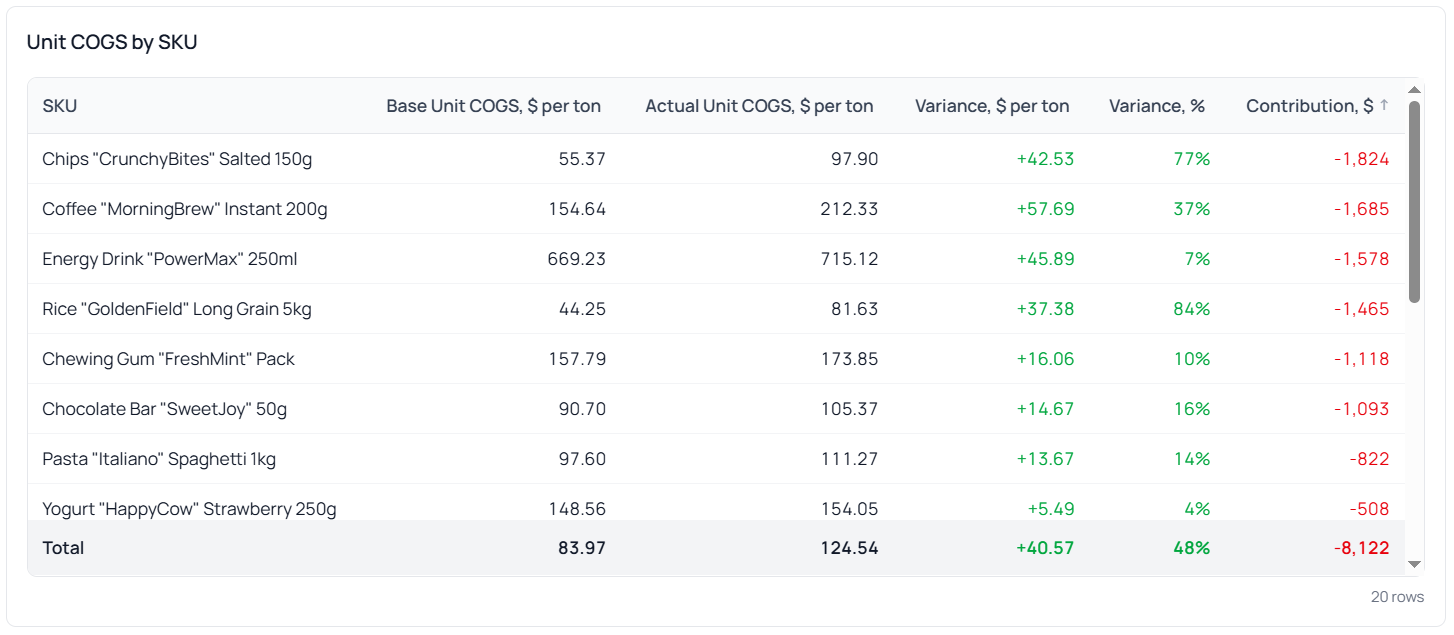 Now we can see exactly which product COGS changes drove the gross profit impact. For example, for product “Chips "CrunchyBites" Salted 150g”: the increase in COGS by $42.53 per ton (or 77%) resulted in a gross profit decrease of $1,824 in monetary terms.
Similarly, we can identify the reasons behind variances for any driver of interest and understand what requires focus and effort to increase gross profit.
Conclusion
Fincontrollex Gross Profit Variance Analysis provides a streamlined way to understand performance drivers. Instead of spending hours building complex formulas, you simply enter four key inputs and receive a complete breakdown: a waterfall chart, a summary table of total impacts, and SKU‑level details with both absolute and relative variances. Results can be exported directly to Excel for further use. And when executive commentary is needed, the prepared output can be transformed into concise conclusions with the help of AI. The approach ensures maximum clarity with minimal effort, keeping the focus on what the drivers behind gross profit changes are.
For more details and to try the tool, visit https://www.fincontrollex.com/analyses/gross-profit-variance-analysis